
The QR code is no longer a novelty — it is a global economic force. In 2026, the worldwide QR code market is valued at USD 15.23 billion, growing at a 16.82% compound annual growth rate that will push it past USD 33 billion by 2031. Nearly 2.9 billion people now use QR codes worldwide, scan rates have surged 323% since 2021, and QR-initiated payment transactions are on track to hit $3 trillion globally in 2025. For any business relying on physical-to-digital customer journeys, these numbers are not background noise — they are strategic intelligence.
This guide compiles the most authoritative QR code statistics for 2026, sourced from Mordor Intelligence, Grand View Research, Juniper Research, Bitly, and independent market researchers. Whether you are planning a campaign, benchmarking your adoption, or making the case for QR code investment internally, the data below gives you everything you need.
The QR code market has entered a period of sustained, high-velocity growth unlike anything in its thirty-year history. According to Mordor Intelligence, the market reached USD 13.04 billion in 2025 and has grown to USD 15.23 billion in 2026, with a clear trajectory toward USD 33.14 billion by 2031. Earlier projections estimated a more modest 8.7% CAGR; current data reveals growth nearly twice as fast at 16.82% CAGR.
Dynamic QR codes now dominate the market with a 64.35% share in 2025, expanding at an 18.85% CAGR — outpacing the overall market. Their ability to be updated, redirected, and tracked without reprinting makes them indispensable for modern campaigns. By 2026, analysts project dynamic codes will account for more than 70% of all QR deployments. If your business is still generating static codes, the data strongly suggests it is time to reconsider. See our dynamic vs. static QR code guide for a full breakdown of which format fits which use case.
Asia-Pacific commanded 38.75% of global market share in 2025 and is posting the fastest regional growth at 17.95% CAGR through 2031. North America follows, accounting for 39% of global scan volume and driving significant innovation in retail and marketing applications. Europe is experiencing regulation-accelerated growth as the EU's Digital Product Passport mandate takes hold.
Raw adoption numbers tell the real story of how entrenched QR code technology has become in consumer behaviour.
The US is one of the world's most active QR code markets despite being a later adopter than Asia-Pacific. 99.5 million American smartphone users are expected to scan a QR code in 2025 — roughly 42.6% of adult smartphone owners. QR code creation in the US increased by 248% compared to pre-pandemic baselines, and the country accounts for 42.2% of global scan volume.
Asia-Pacific remains the world's most advanced QR code market. China leads all nations with a 67.4% monthly QR scanning rate, while Malaysia (66.1%), Thailand (61.5%), and Brazil (60.8%) round out the top five. India's UPI QR network has grown to over 709 million active QR codes — a network that more than doubled in 18 months and now powers everything from street vendor payments to railway ticketing.

Understanding who scans — and why — is essential for any QR code marketing strategy. The data reveals clear demographic patterns and a strong link between scanning behaviour and purchase intent.
The commercial case for QR codes is compelling: 79% of consumers report being more likely to purchase a product if it has a QR code providing additional information. And 64% of shoppers have already scanned a QR code on a product while shopping in-store. For retailers, this is one of the clearest conversion signals in modern commerce.

QR code payments represent the highest-velocity segment within the broader market. According to Grand View Research, the global QR payment market was valued at USD 12.54 billion in 2024 and is projected to reach USD 61.73 billion by 2033 at a 20.0% CAGR. Alternative forecasts from Future Market Insights estimate the segment could reach USD 73.44 billion by 2035. Either way, the trajectory is unambiguous: QR payments are a multi-decade growth market.
China leads the world with 90% of all mobile payments processed via QR codes, generating USD 3.74 trillion in annual transaction value through Alipay and WeChat Pay. India's UPI system has transformed from a pilot into one of the world's largest payment networks, facilitating 42% year-over-year growth with 481 billion projected transactions by 2029. Asia-Pacific accounts for over 60% of all global QR payment activity.
North American adoption is accelerating rapidly: 58% of American consumers regularly use QR codes for restaurant and grocery payments, and the region commands 39% of the global QR payment market. In Southeast Asia, 69% of consumers say they intend to use QR payment for future transactions.
QR code adoption has reached maturity across virtually every major industry, but the depth and application vary significantly by sector.
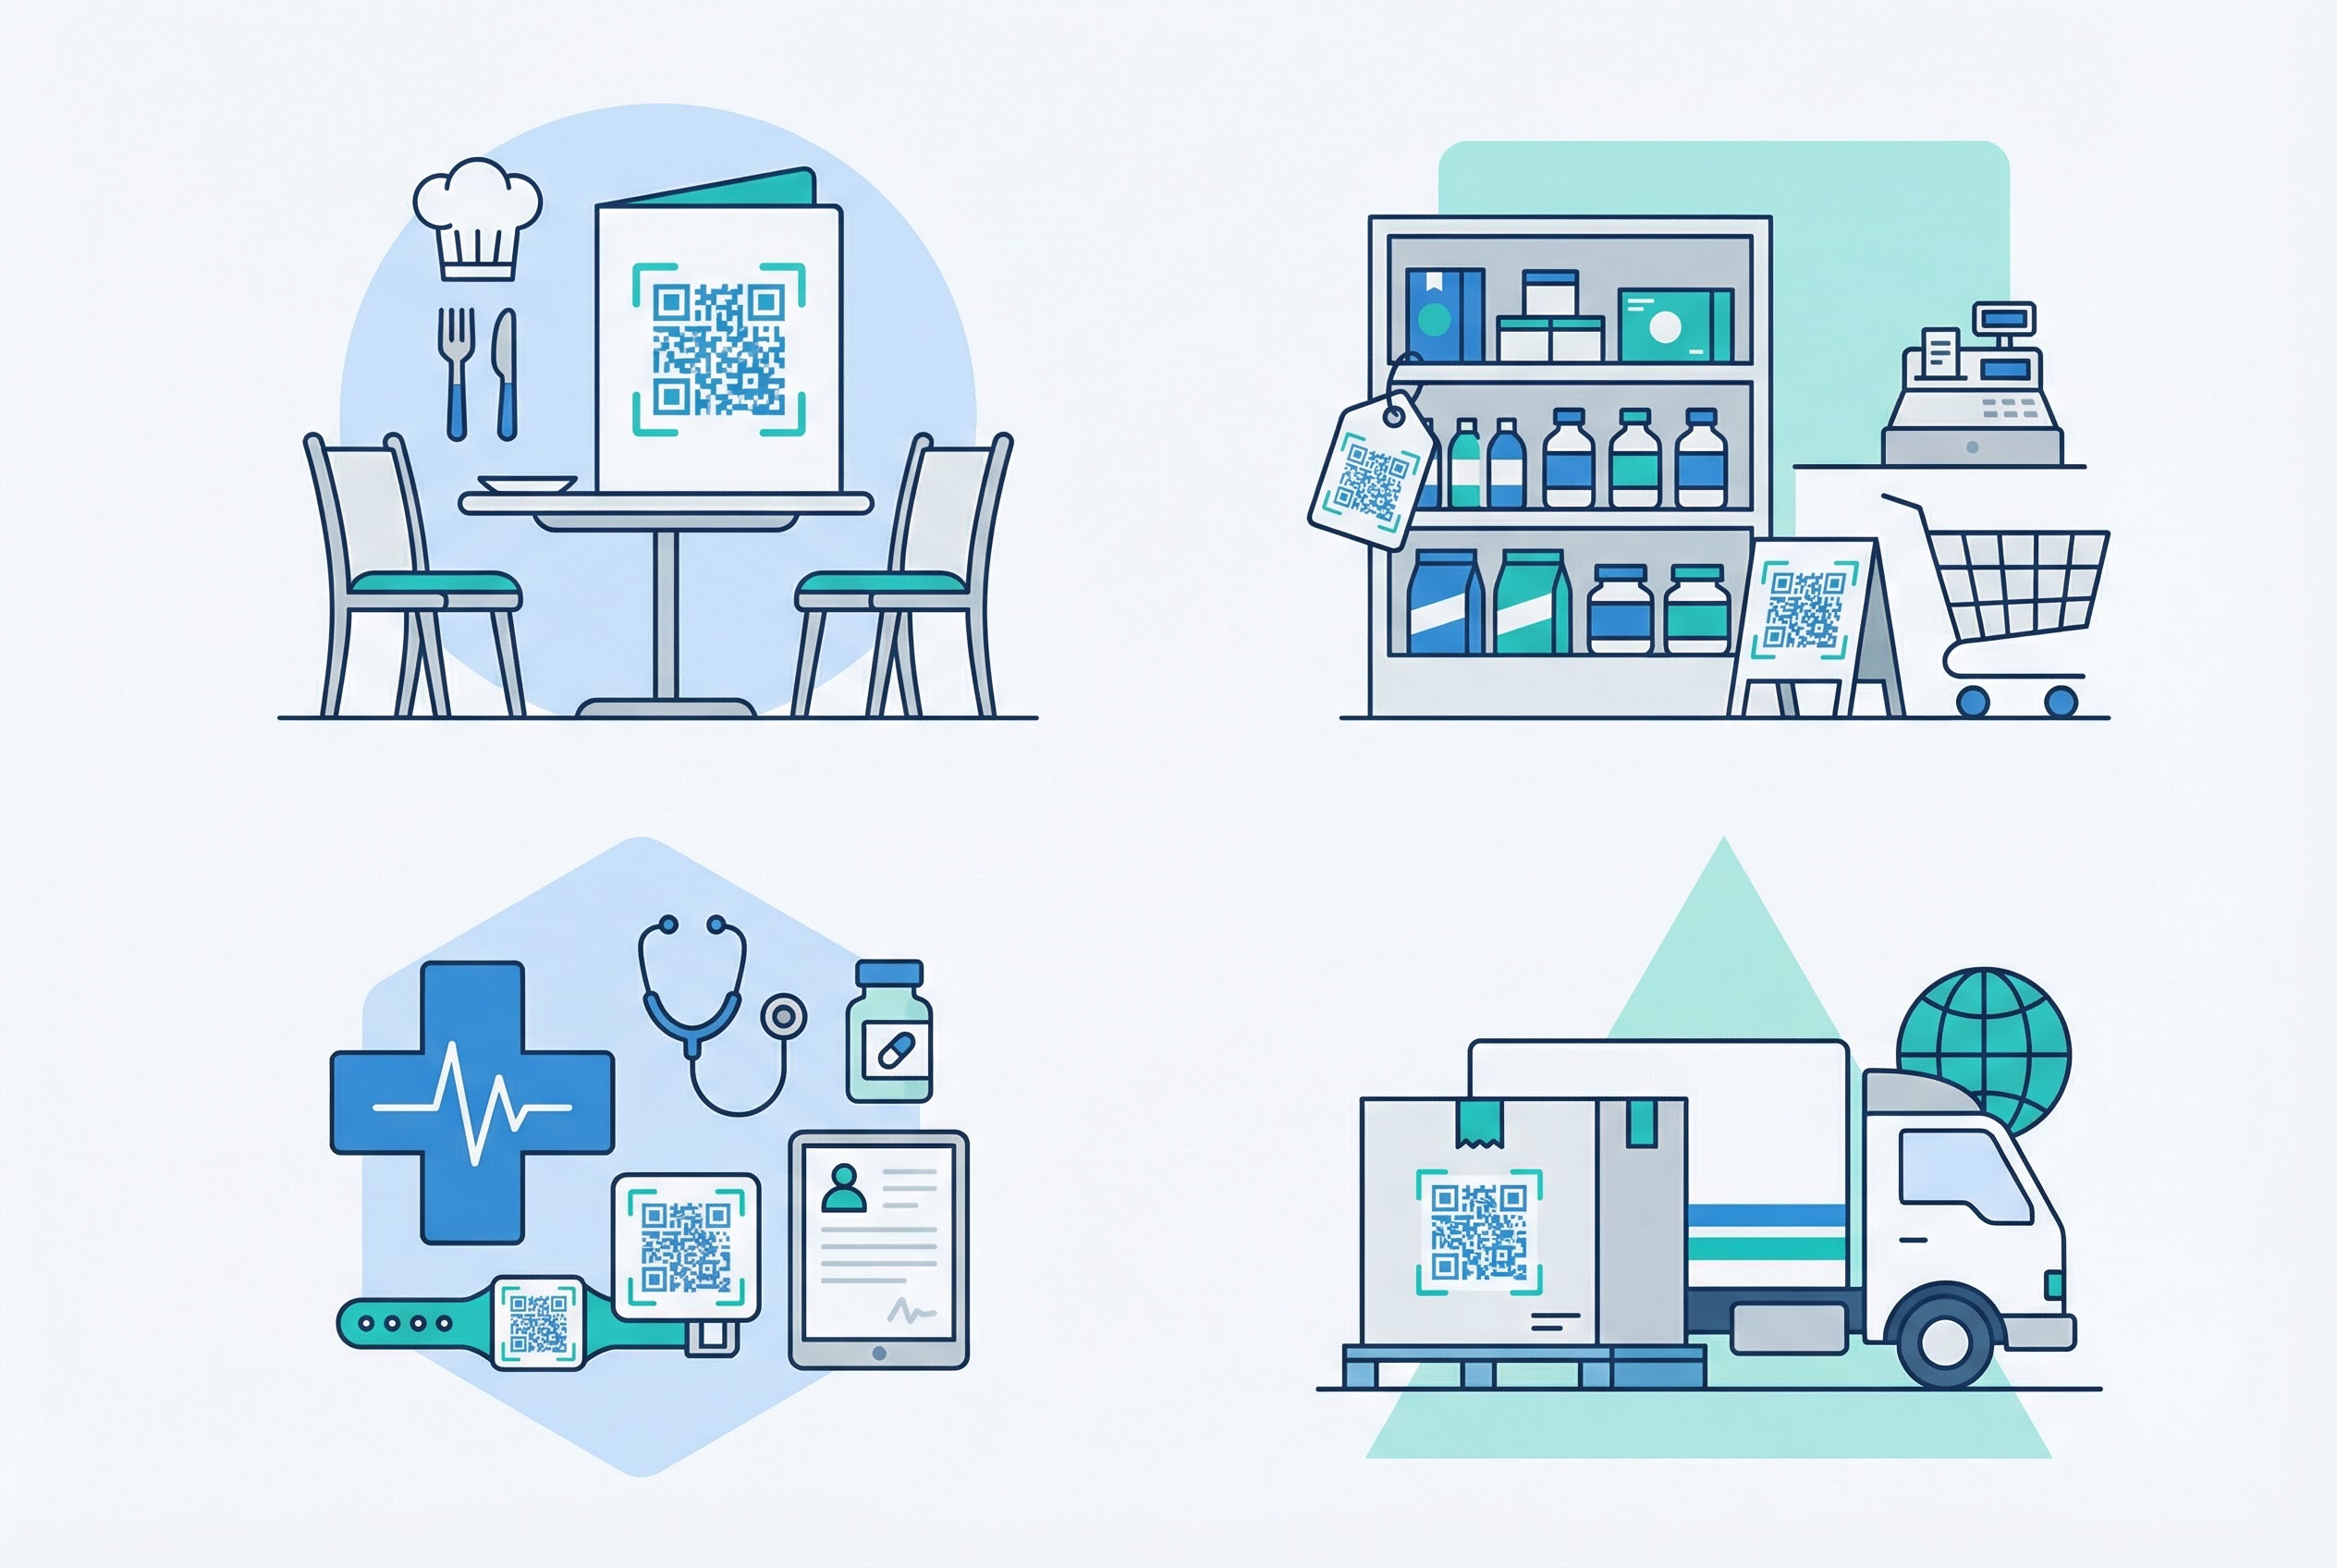
The pandemic accelerated an adoption curve that has not reversed. 75% of restaurants worldwide now use QR codes for digital menus, ordering, or payments, and 78% of diners favour QR codes for their convenience. In the US specifically, 52% of restaurants have implemented QR menus. Food service operators implementing QR menus report 15% faster table turnover and a 27% increase in average order value. Explore how restaurants are deploying these tools on our QR codes for restaurants use case page.
Retail is one of the fastest-evolving QR markets, with 88% year-over-year growth in QR code usage across the sector. 46% of retail marketing now incorporates QR codes on packaging or in-store displays. Omnichannel retailers using QR codes to bridge physical and digital retain 89% of customers compared to just 33% for single-channel competitors. Learn how retailers are winning with QR on our QR codes for retail page.
Healthcare is the fourth-largest industry segment for QR adoption. Hospitals and clinics use QR codes for patient wristbands, prescription tracking, appointment scheduling, and secure record access. 83.7% of women report positive experiences using QR codes for health information. The US government's November 2024 mandate requiring unit-level QR identifiers on all prescription drugs has made QR codes non-optional for pharmaceutical supply chains. See our QR codes for healthcare page for implementation strategies.
Marketing drives 40% of all global QR code scans. The sector saw a 323% increase in QR usage between 2021 and 2023, and the CMO Council reports that 70% of marketers are already combining QR codes with augmented reality in their campaigns. See more data in our dedicated QR code marketing ideas guide.
For marketers, the performance metrics are striking. QR-initiated journeys deliver results that traditional digital channels rarely match. According to the State of QR Codes 2025 report:
49% of marketers rate adding a company logo as the single most valuable customisation feature. Branded QR codes — which signal trust to the scanner — correlate with higher scan rates and lower abandonment rates post-click. The top performance metrics marketers track are unique users (54%), conversion rate post-scan (52%), and total scans (50%).
As third-party cookies are eliminated across browsers and platforms, QR codes have become one of the primary channels for permission-based first-party data collection. With 95% of businesses already collecting actionable data through QR implementations, the technology is now central to post-cookie audience strategy, not just a physical-to-digital bridge.
The shift toward dynamic QR codes is one of the clearest trends in the data, and the gap between the two formats is widening. For a deep technical comparison, see our complete guide to dynamic vs. static QR codes.
The operational argument is clear: dynamic codes eliminate the cost of reprinting when campaigns change, while simultaneously providing the scan-level data needed to optimise performance. For URL QR codes in particular, dynamic formats allow marketers to update destination pages long after materials have been printed or distributed.
The rapid adoption of QR codes has created a parallel rise in QR-based cyberattacks — a threat category now widely known as "quishing" (QR phishing). Every business deploying QR codes needs to understand the scale of this threat. Read our full guide to QR code safety and quishing for protective measures.
The response requires a multi-layered approach: using branded, verifiable QR codes; employing generators with encrypted tokens; and educating users to verify URL destinations before entering credentials. Platforms like Supercode incorporate code integrity features that help businesses maintain consumer trust at every scan.
Government mandates are turning QR codes from a marketing option into a legal requirement in several major markets — a trend that will accelerate adoption regardless of consumer preference.
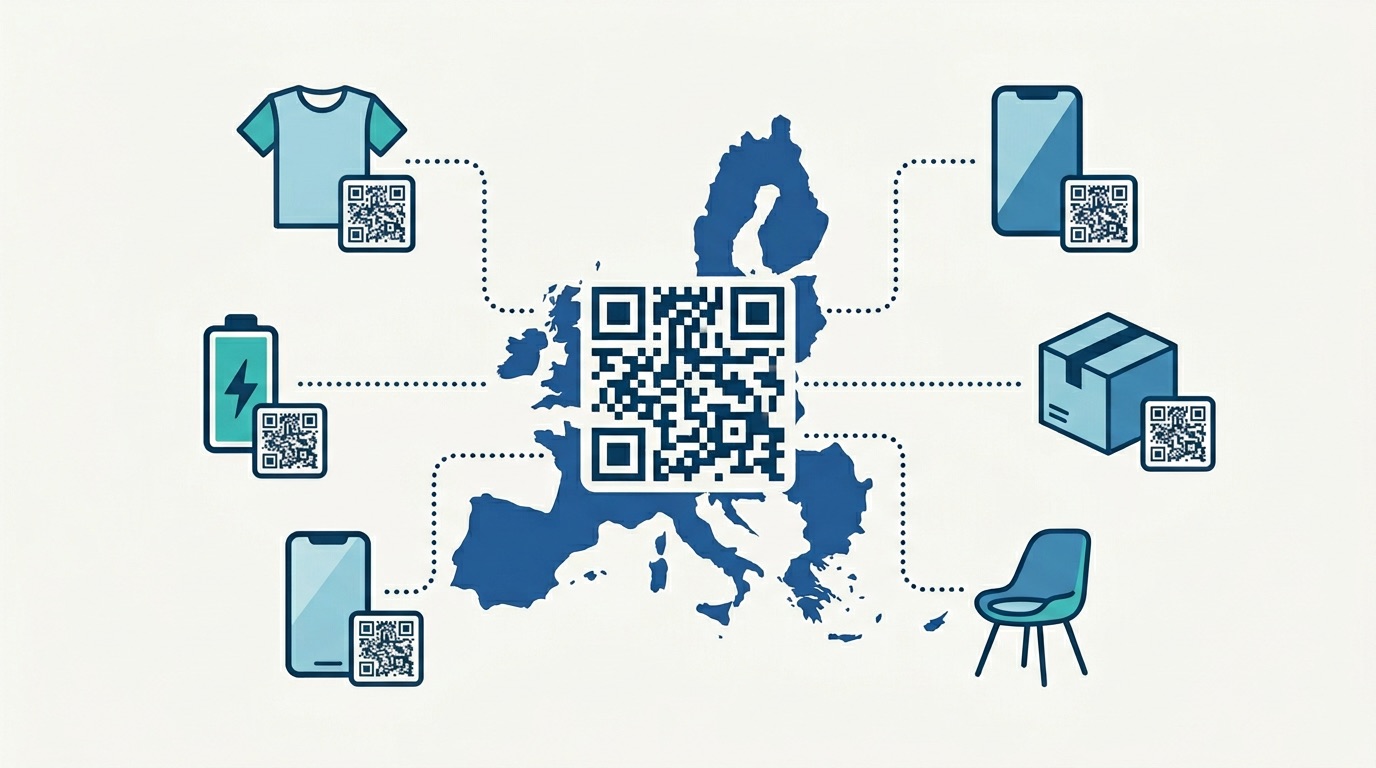
The EU's Ecodesign for Sustainable Products Regulation (ESPR) — in effect since July 2024 — requires products in 30 categories (textiles, electronics, batteries, furniture, and more) to carry a scannable identifier linking to sustainability, composition, and lifecycle data by 2030. Battery products face the first DPP compliance deadline in 2026. This single regulation will mandate QR code adoption for thousands of manufacturers supplying the EU market.
Industry is already responding: 82% of retailers and 92% of brand owners support replacing traditional UPC barcodes with GS1 QR codes by 2025, and analysts predict traditional barcodes will be fully replaced by QR technology starting in 2027.
Since November 2024, all US prescription drugs are required to carry a unit-level identifier — implemented via QR codes — to combat counterfeiting. This makes QR codes mandatory infrastructure for the entire US pharmaceutical supply chain.
India's government-backed Unified Payments Interface now supports over 709 million active QR codes and processes transactions with 42% year-over-year growth, making it one of the world's largest QR-enabled financial systems. This regulatory and infrastructure support has made QR the de-facto payment standard for millions of Indian merchants of all sizes. For a broader view of trends shaping the market, see our QR code trends 2026 analysis.
Data is only valuable when it drives action. Here is how the statistics above translate into practical business decisions:
With dynamic codes holding 64.35% of the market and growing at nearly 19% annually, there is no strategic reason to generate static codes for ongoing marketing campaigns. Dynamic codes let you update destinations, run A/B tests, and track every scan — capabilities that directly improve your ROI. Start with Supercode's dynamic QR code generator to create trackable, editable codes for all your campaigns.
With 95% of businesses already collecting first-party data via QR and third-party cookies disappearing, QR codes are a natural fit for building compliant consumer audiences. Design your landing pages to capture opt-ins, preference data, and behavioural signals at the moment of scan — when intent is highest.
The 87% of marketers struggling to track post-scan journeys represent both a challenge and an opportunity. Businesses that close this gap — using platforms with built-in scan tracking, geographic data, device analytics, and conversion attribution — gain a measurable competitive edge. Our QR code tracking guide covers the full measurement framework.
If you operate in retail, manufacturing, food and beverage, or pharmaceuticals, the EU DPP and US drug-tracking mandates are coming for your supply chain. Starting your QR infrastructure now — with a scalable, enterprise-grade platform — positions you ahead of compliance deadlines rather than scrambling at the last minute. Review Supercode's pricing — every feature on every plan, choose the scan volume for your deployment scale.
Quishing is a real and growing threat. Build security into your QR deployments from day one: use branded codes, employ platforms with integrity verification, and run internal education about quishing risks — particularly for senior executives who are 42x more likely to be targeted.
To implement any of the strategies above, start with a solid foundation. Our complete guide to creating a QR code walks through every step from generation to deployment.
The global QR code market is valued at USD 15.23 billion in 2026, according to Mordor Intelligence. It is growing at a 16.82% compound annual growth rate and is projected to reach USD 33.14 billion by 2031. The payments segment alone is expected to reach USD 61.73 billion by 2033.
An estimated 2.9 billion people worldwide are expected to use QR codes by 2025, representing roughly 37% of the global population. Of these, approximately 2.2 billion use QR codes specifically for payment transactions. In the United States, 99.5 million smartphone users are projected to scan QR codes in 2025.
Marketing and advertising drives 40% of all global QR scans. Restaurants and hospitality show the highest penetration rate, with 75% of restaurants worldwide using QR menus. Retail follows with 88% year-over-year growth in QR adoption, and healthcare is the fourth-largest industry segment. Logistics and supply chain are rapidly scaling with QR inventory tracking.
QR-initiated marketing journeys achieve an average 37% click-through rate — significantly higher than the 2–5% typical of display advertising. This reflects the high intent of users who physically scan a code, making QR codes one of the highest-converting touchpoints in the modern marketing mix.
Dynamic QR codes held a 64.35% market share in 2025 and are projected to exceed 70% by 2026. Their ability to be updated after printing, combined with built-in scan analytics, makes them the preferred format for business deployments. Approximately 79% of businesses have adopted dynamic QR codes.
Very serious, and growing rapidly. QR phishing attacks grew 587% year-over-year in 2024, with Kaspersky reporting a further fivefold surge in the second half of 2025. QR codes now account for 12% of all phishing attacks. Only 36% of victims correctly identify a quishing attempt, and executives are 42 times more targeted than regular employees. Using branded, verified QR codes from a trusted platform significantly reduces exposure.
Yes — industry consensus points to 2027 as the start of barcode replacement at scale, driven by the EU's Digital Product Passport requirements and GS1's transition to 2D codes. Already, 82% of retailers and 92% of brand owners support replacing UPC barcodes with GS1 QR codes. The EU mandates QR-based product identifiers across 30 categories by 2030.
The statistics are clear: QR codes are no longer a marketing tactic — they are critical business infrastructure. With a $15.23 billion market, nearly 3 billion users, $3 trillion in payment transactions, and regulatory mandates across major economies, the question for businesses is not whether to use QR codes, but how to use them well.
Supercode gives you everything you need to deploy QR codes at any scale: dynamic codes with real-time editing, campaign-level analytics, custom branding, bulk generation, and enterprise security features. Whether you are running a single campaign or managing thousands of codes across multiple markets, Supercode is built for the task.
Sign up free today and put the world's most powerful QR code platform to work for your business.